Make a pie chart of your crypto revenues.
Examples
all.data <- format_exchanges(list(data_shakepay, data_newton))
#> Exchange detected: shakepay
#> Exchange detected: newton
formatted.ACB <- format_ACB(all.data, verbose = FALSE)
table.revenues <- report_revenues(formatted.ACB)
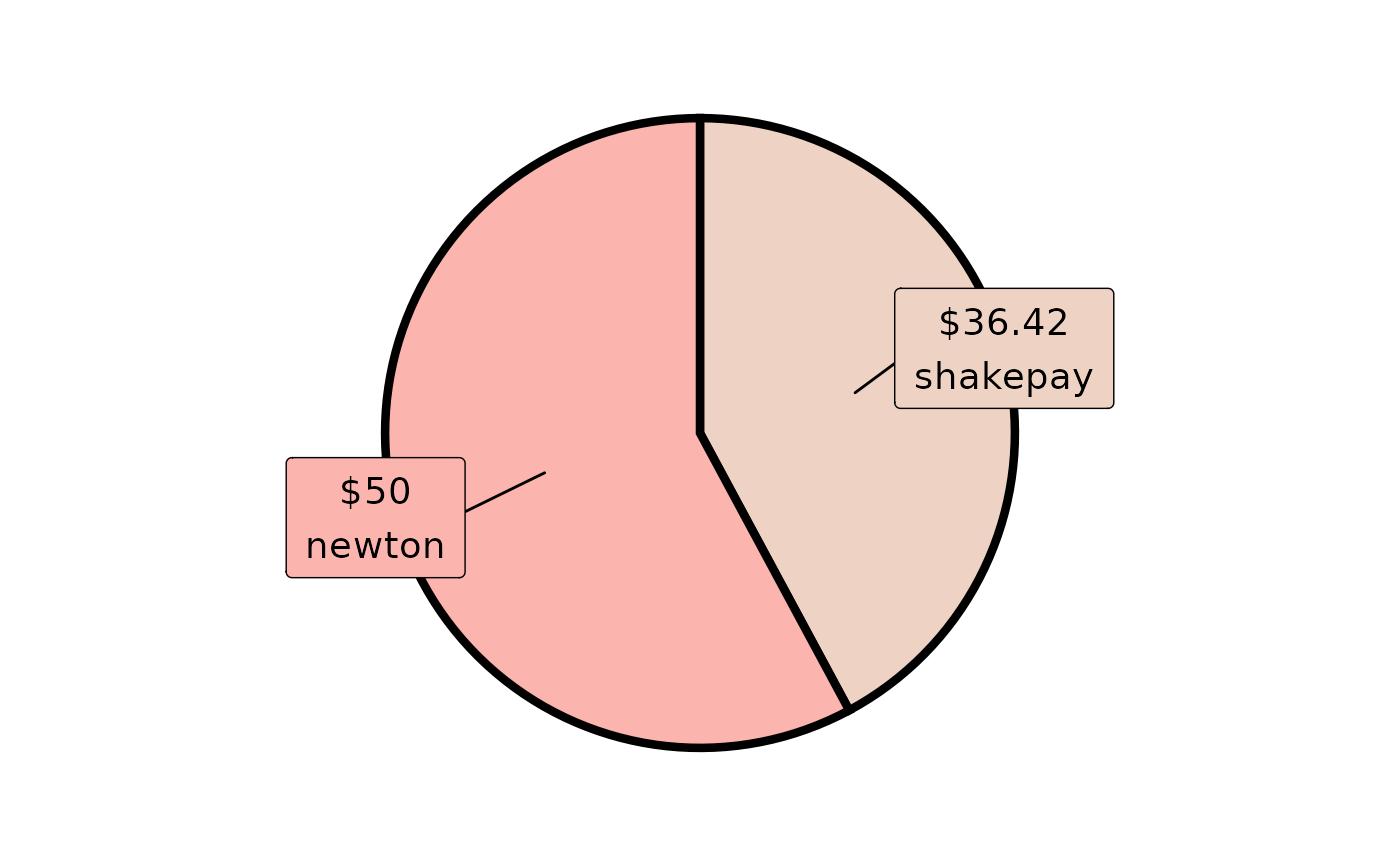
crypto_pie(table.revenues)
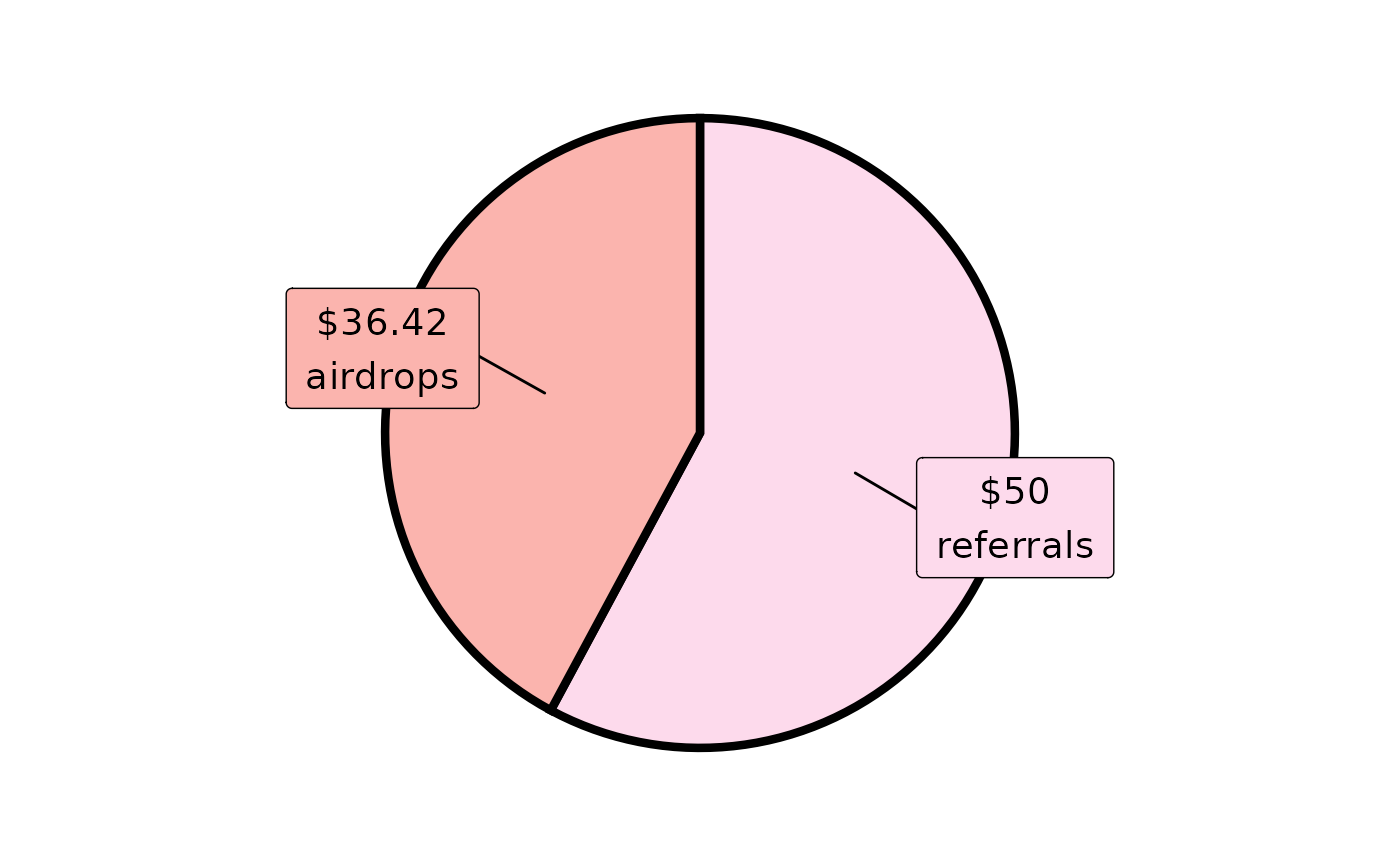
 crypto_pie(table.revenues, by = "revenue.type")